As the education community continues to mobilize efforts towards achieving Sustainable Development Goal 4 (SDG 4), stakeholders at all levels of the system are grappling with questions on how to deliver inclusive quality education. What communities will benefit most from school construction or improved transport networks? Where are the biggest shortages of well-qualified teachers? Which learners remain unable to access remote learning opportunities? Geospatial data and analysis have the potential to answer these questions and more. In doing so, geospatial analysis can support global, national, and sub-national stakeholders to make decisions about more equitable education service delivery. Here are five ways organizations are leveraging geospatial data and analysis to visualize and solve some of education’s biggest challenges:
1. Using geospatial data to identify hard-to-reach students: GRID3
In countries where high-resolution, geo-enabled data on population and infrastructure is accessible, navigation tools and recent census data can be used by policymakers to plan infrastructure and the shortest routes for service delivery. In the education sector, understanding the spatial distribution of school-age children and schools can provide valuable, localized insights into several crucial factors, including accessibility. For example, these data help us to understand the number and locations of underserved pupils, which can improve strategic decisions on planning and resource allocation.
One way of examining accessibility in education is by looking at the physical distances that students must travel from their homes to reach the closest, age-appropriate school. Using multiple geospatial tools and high-resolution data that includes roads, land cover, elevation, and school locations, geographic information system (GIS) software can help map the shortest route from a community to the nearest school and estimate the associated travel time. Communities can be grouped together based on their proximity to the nearest school, allowing for the creation of school catchment areas that maximize reach for those previously left behind. These tools and analyses provide insights into what areas and individual communities are “out-of-reach” (e.g., over 60 minutes away from the nearest school by walking).
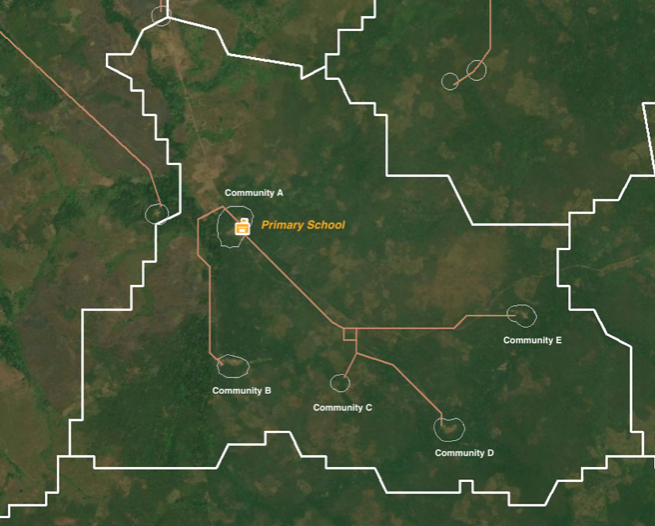
The data above is an example and does not contain real values.
Using this information in combination with other constraints (such as the number of relevant school-aged children), specific areas can be prioritized for school expansion or new school construction. Placement of schools can be further optimized using GIS so that they are within a certain time or distance and reach the greatest number of potential students. See additional analysis by Rodriguez-Segura and Kim on ‘education deserts’.
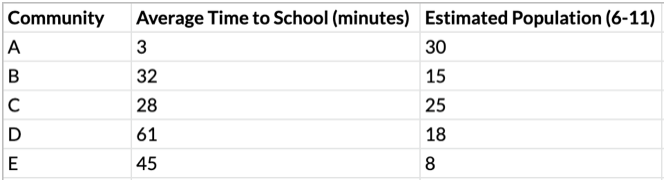
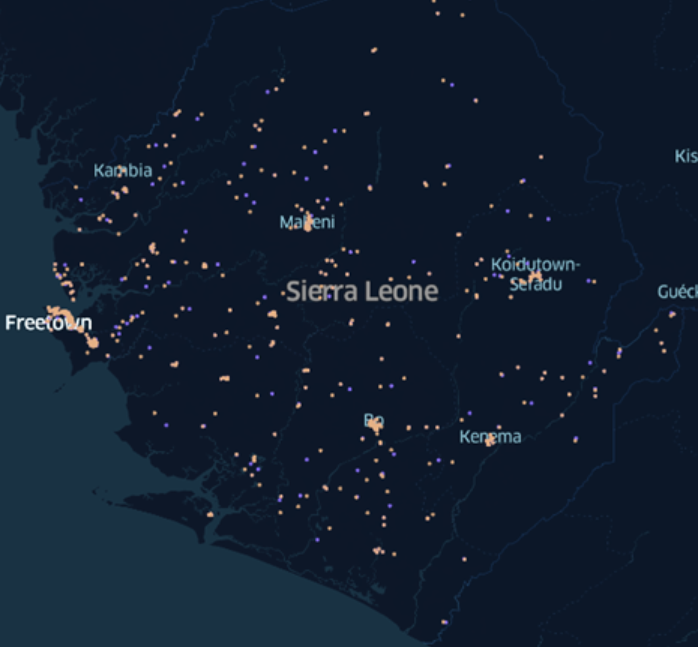
The blue highlighted areas are communities in Sierra Leone (GRID3 settlement extents) estimated to be more than 60 minutes away by walking and motorized vehicle from the nearest junior secondary school.
2. Understanding school and community connectivity and the viability of alternative modes of learning: International Telecommunication Union (ITU), UNESCO, and UNICEF as part of the Broadband Commission
At the height of COVID-19, 1.6 billion learners around the world were affected by school closures, many with limited access to other modes of learning such as radio, television, or e-learning through computers or tablets. The Broadband Commission, established in 2010 by the ITU and UNESCO, aims to boost the importance of broadband on the international policy agenda and expand broadband access for the 3.6 billion people around the world who currently lack access to the internet.
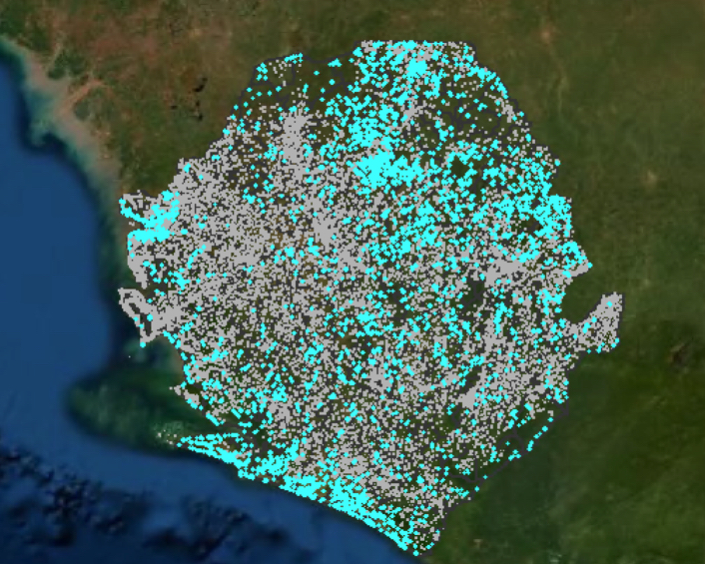
In the joint report released in 2020, the Working Group on School Connectivity advocates for mapping schools and their connectivity as a core building block for any strategy to improve connectivity, especially in areas most left behind. An estimated 465 million children and youth do not have access to the Internet at home, and thus cannot be reached by remote learning solutions. But before mapping connectivity, accurate data must first be collected on school locations, number of children reached by those schools, and other factors; most of this data has not been collected and, where it has, is rarely updated. In 2017, Project Connect was launched by Giga, a UNICEF and ITU Initiative with the goal of mapping every school in the world and providing real-time data assessing the quality of each school’s internet connectivity.
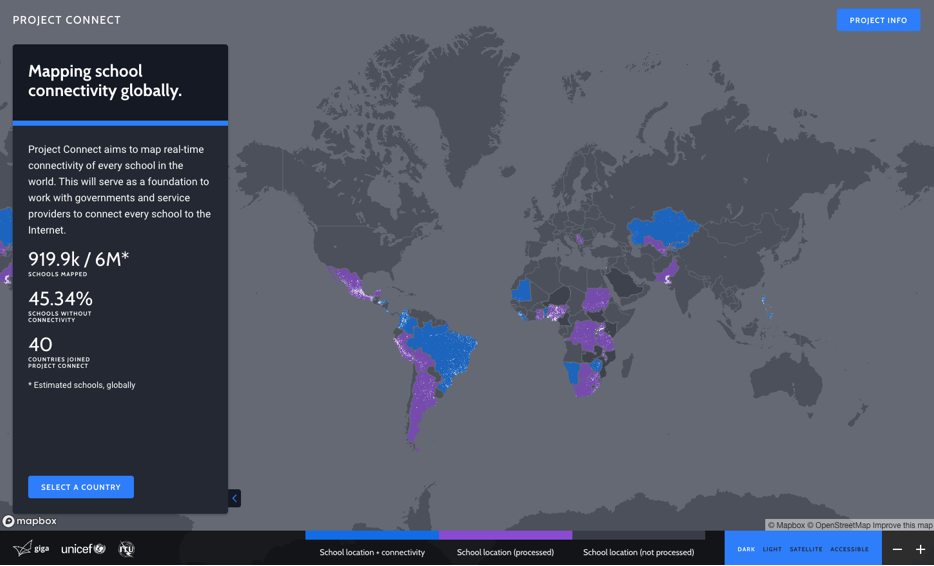
Giga’s approach to school mapping combines a variety of methods to build comprehensive, live maps. In the first phase, a base layer map is created with school locations and available connectivity data. This static dataset serves as an opportunity to identify existing data gaps before moving into phase two, where a live connectivity map is built. The live connectivity map monitors internet access in real-time, reducing inefficiencies, increasing transparency, and improving service delivery.
Rwanda School Mobile Coverage – Giga Mapping
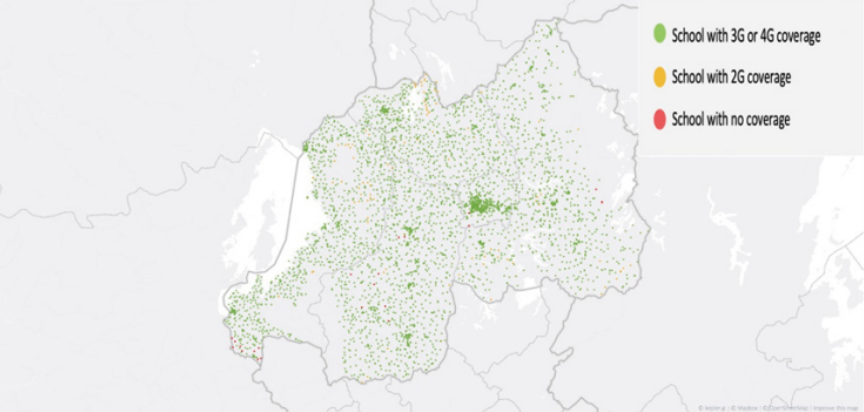
Read the full report released on supporting school connectivity here.
3. Finding innovative ways to allocate teachers to high-need areas: Fab Inc. and the Education Commission
Governments face significant challenges in ensuring equitable deployment of the education workforce. As one of the most critical drivers to student learning in the classroom, optimizing the allocation of teachers to high-need areas is critical to improving equity and increasing student learning outcomes. GIS and spatial analysis can help unpack workforce allocation issues and identify localized solutions to improve equity.
In Sierra Leone, headline pupil-teacher ratios at the national or district levels often hide significant disparities at local levels, especially in more remote areas. For example, at the secondary level, there are greater shortages of core subject specialists in remote schools. At the same time, many secondary school teachers are under-utilized due to small school sizes where there are not enough pupils to fill the teacher’s timetable. Spatial analysis can be used to match these two instances and identify schools that are lacking core subject specialists within walking distance of other schools that have under-utilized specialists in those subjects. Improving workforce allocation could take a range of forms depending on the context: splitting the specialist’s time between both school locations, either physically or using technology; partnering specialized and non-specialized teachers in mentoring schemes; and/or using spatial analysis to predict where future shortages may occur and strengthen recruitment. All options could both reduce the shortage in specialist skills while making better use of the specialists currently within the system. In this way, over one-quarter of secondary schools that currently lack core subject specialists could be covered by currently under-utilized subject specialists from nearby schools. Read the full analysis on Sierra Leone by the Education Commission and Fab Inc.
Schools with under-utilized specialists (orange) and in-need schools within 5km (blue).
4. Making school inspection routes more efficient to support accountability, quality, and performance of education systems: UNESCO-IIEP
School inspections play a key role in maintaining the quality of an education system: not only is it a way of supervising, monitoring, and evaluating schools’ and teachers’ performance, inspection is also a tool to inform schools of the resources available at upper administrative levels and to ensure the efficient implementation of reform and educational policies. In some cases, inspection mechanisms represent a channel, and possibly the only one, for the delivery of physical resources such as books, teaching aids, or similar supplies to the school visited. Inspections also provide an opportunity to feedback to policymakers the realities of implementing policies in schools.
Despite efforts in setting inspection standards and professionalizing the inspection profession, a major hurdle faced by inspectors is to actually visit all their schools in the expected amount of time. Some schools are accessible only during specific times and seasons, visits have different time durations, and transportation resources often used by inspectors are not always available. Given these and other constraints, the question becomes: if inspection routes are optimized, can more schools be visited more frequently, and will that boost inspector motivation and have a direct impact on aspects of education quality?
Geospatial data science can support inspection services to create optimized route scenarios at the ministry, management, or individual level.
At the individual level, an inspector can organize their visit calendar by priority level, combine short visits into an optimal route, and schedule longer trips in a more efficient way. An inspector can create records for the anticipated visits in a single year with all their characteristics, and generate the different routes that would save time and resources.
Managers can use the analysis to identify challenges and potential efficiency gains and balance the needs (and requests) for extra staff, different assignments, or additional travel resources.
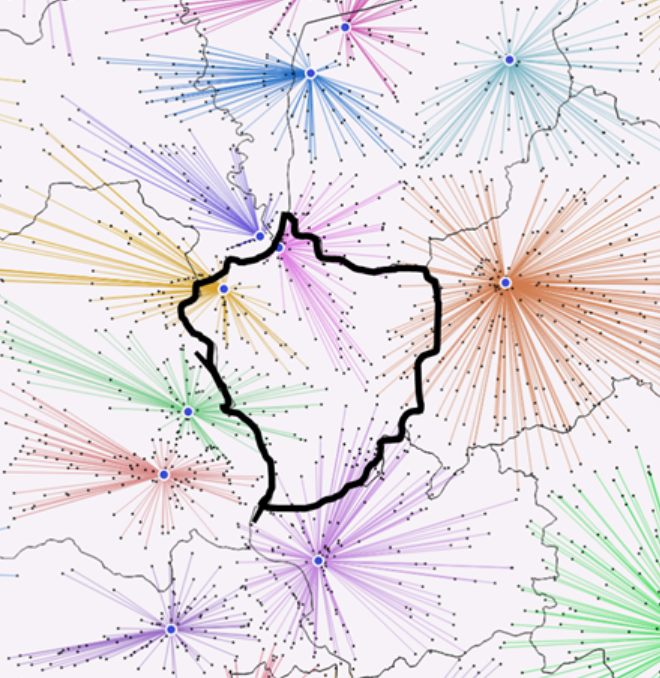
At the ministry level, geospatial analysis can provide insights to organize inspection routes more efficiently, regardless of other factors. For example, as shown in Figures 1 and 2, does it make sense to have inspectors clustered in main cities? Should inspection territories be organized independently of administrative boundaries?
Inspection services can often contain political processes, where geospatial data’s impact is limited. But using the spatial perspective to resolve bottlenecks or prepare system reforms can bring more depth to policy dialogues and help visualize the scale of the challenges.
Inspection services are typically designed to take place within specific administrative boundaries
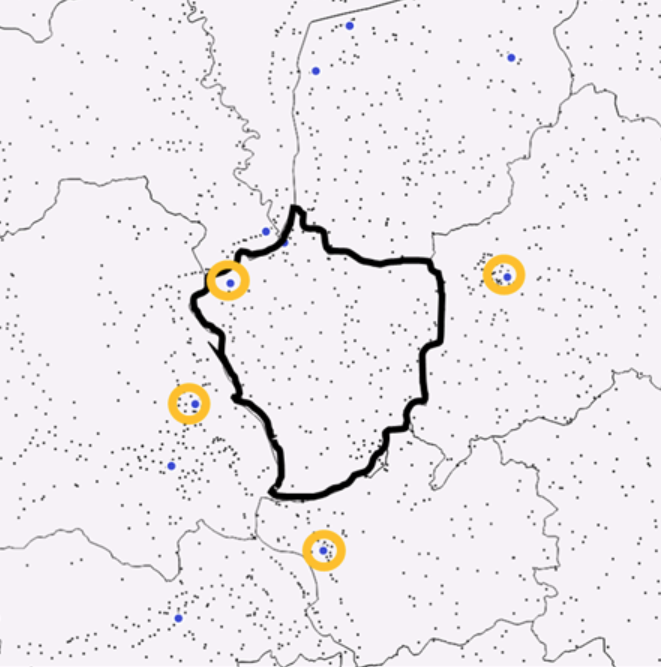
What if geospatial data science could help education ministries rethink collaboration and inspection services across regional boundaries?
The designations employed and the presentation of the material above does not imply the expression of any opinion whatsoever on the part of UNESCO or IIEP concerning the legal status of any country, territory, city, or area, or of its authorities, or concerning the delimitation of its frontiers or boundaries. This material has been partly funded by UK aid from the UK government; however, the views expressed do not necessarily reflect the UK government’s official policies.
Contact development@iiep.unesco.org if you are interested in learning more or piloting this methodology in this country.
5. Analyzing and expanding coverage of the Education Radio Initiative to support remote learning: Flowminder through funding from GRID3
During the 2014-2016 Ebola crisis, schools in Sierra Leone were forced to shut their doors to reduce virus transmission, disrupting education for thousands of children. To educate pupils remotely, the Ministry of Basic and Senior Secondary Education (MBSSE) launched its Radio Teaching Program where teachers broadcast lessons nationally so pupils could continue learning from the safety of their home.
In March 2020, MBSSE rolled out the same initiative in response to the COVID-19 pandemic school closures but was aware of broadcast access inequalities from one region to another through its learnings from the Ebola response. These coverage gaps were caused by the limited range of the nine transmitters used to broadcast the lessons. To solve this challenge, the ministry reached out to GRID3 to provide geospatial data solutions that would improve radio coverage.
In conjunction with radio wave propagation models, the GRID3 team at Flowminder applied GIS techniques to conduct a three-phase analysis. GIS can be a powerful tool to identify areas that are underserved by existing infrastructure and to model options for service expansion. Flowminder estimated the current population coverage using Nautel’s Radio Coverage Tool, assessed the broadcast power of other transmitters to expand coverage, and used its optimization algorithm to simulate locations for where new transmitters should be built.
The analysis estimated that 66% of school-age children were within range of the nine Education Radio transmitters, with border districts in the south and north of the country often being out of range. It also identified 14 “alternative transmitters” used by other radio stations that had high potential for boosting coverage and increasing coverage to 91% of children. These were ranked based on the number of unserved school-age children living within 40km of a transmitter, a figure chosen as a simplified estimate of signal range.
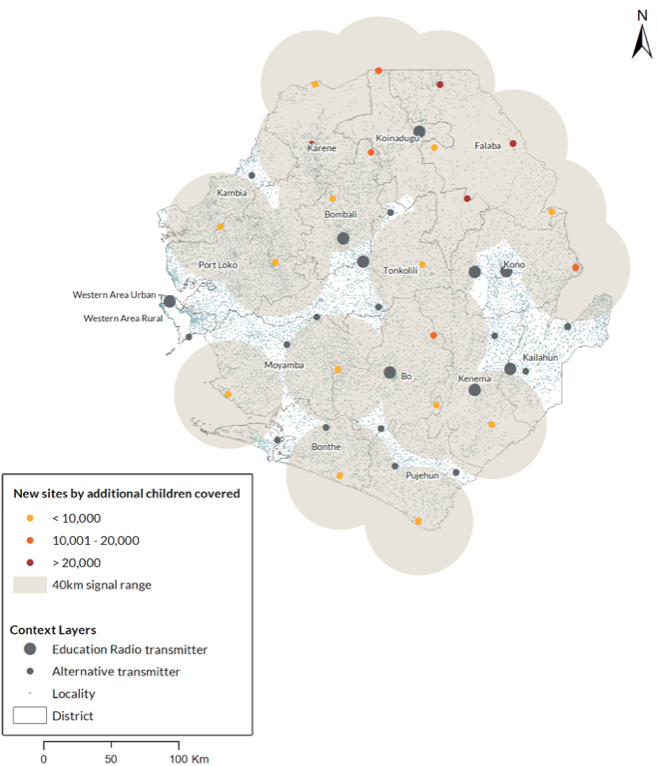
Flowminder then modelled two scenarios with its optimization algorithm to achieve complete coverage. Scenario 1 incorporated the 14 alternative transmitters, identifying 21 locations to build new transmitters. Scenario 2 only used the location of the nine existing Education Radio transmitters, delivering 32 new locations. From this analysis, MBSSE is considering the construction of new transmitters, which this study will help inform.
New transmitters from Scenario 1 and their buffers for 40km signal range, along with alternative and Education Radio transmitters.
Achieving SDG 4 will require improved coordination, resource allocation, and prioritization across the education sector. With the right data and tools, geospatial analysis can support stakeholders at all levels of the education system to make data-informed decisions. While only five examples are presented above, the opportunities to leverage GIS for improved decision-making and delivery are endless.
If your organization is using GIS for education decision-making, we welcome you to complete the interest form and tell us how you are using or would like to use GIS for education.
Acknowledgements and contributions: This blog was written on behalf of the GIS for Education Working Group, convened by the Education Commission and co-chaired by the EdTech Hub. Thanks to the following working group members for their inputs and contributions: Annie Werner (GRID3), Ally Mackintosh (Fab Inc.), Alisdair Steward (Flowminder), Amelie Gagnon (UNESCO-IIEP), and to Jessica Bergmann (Education Commission) for coordination.
For more information about the GIS for Education Working Group, please visit the working group website or complete the interest form and we will be in touch.