-
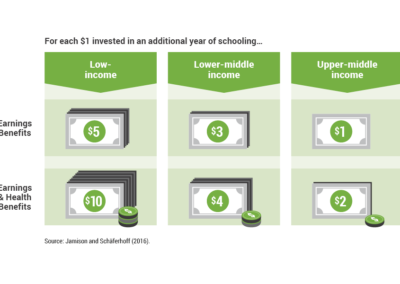
Source: Jamison and Schäferhoff (2016).V3 Note: Health benefits are based on reductions in under-five and adult mortality.
-
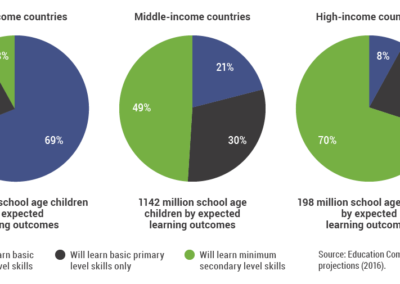
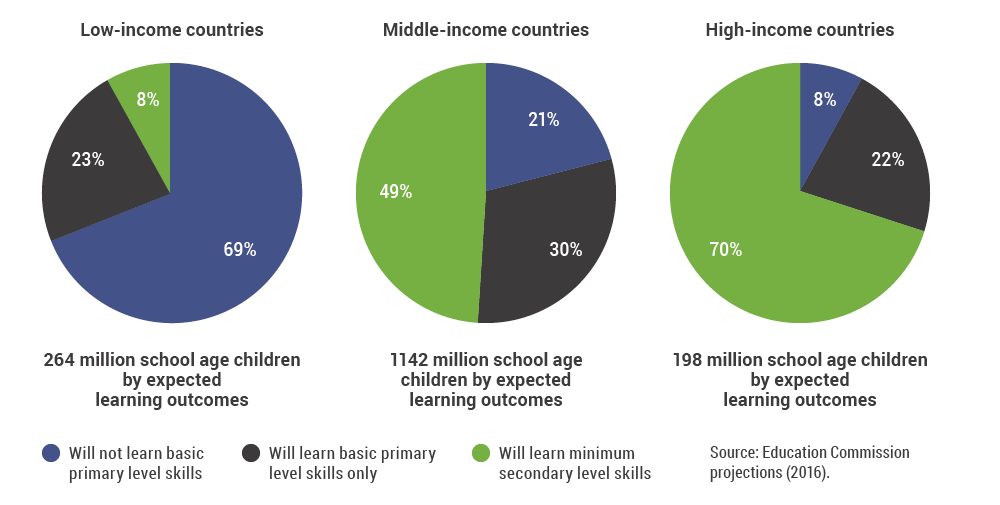
The learning benchmark for primary students is reaching at least level 1 on a PIRLS Grade 4 reading assessment or equivalent. This is used as an available metric, recognizing that actual learning is a much broader and more complex process. The learning benchmark for secondary students is reaching least "low" level on a PISA assessment or equivalent. Again, this is used as a proxy for learning in the absence of more comprehensive assessments. The calculations are based on the assumption that all children and youth in primary and secondary school in2030 will have the same learning outcomes (i.e., the primary school pupils, when they reach adolescence, will have the same secondary school outcomes as their older peers did in 2030). The idea is similar to how the total fertility rate is computed for population projections. One takes the learning outcomes of different ages in year X, and calculates what the learning outcomes would be if everyone of school-age completed their schooling with those learning outcomes.
-
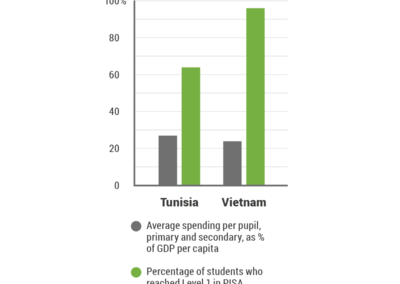
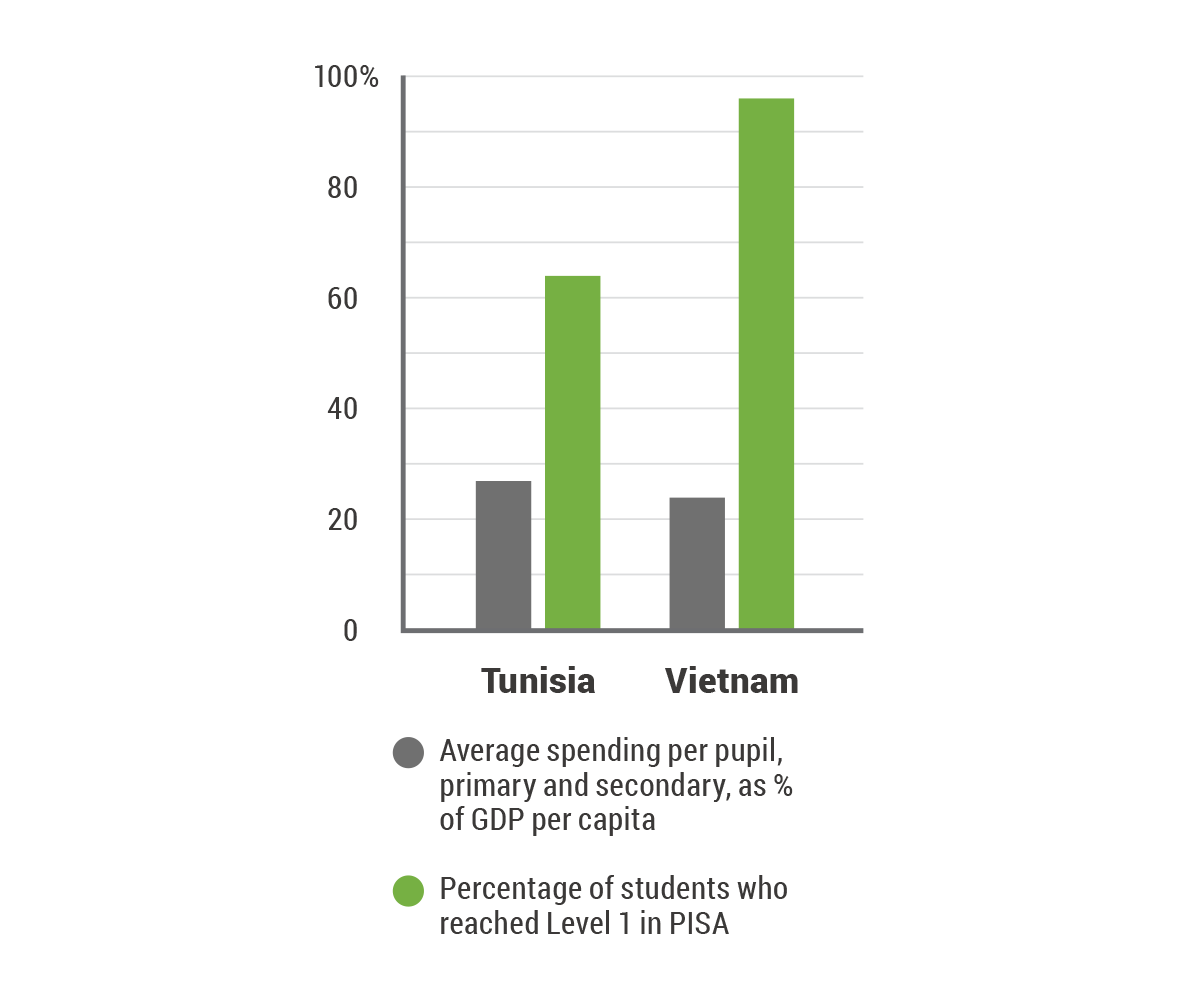
Sources: Education Commission analysis (2016)F7 based on data from UIS and PISA (2012)
-
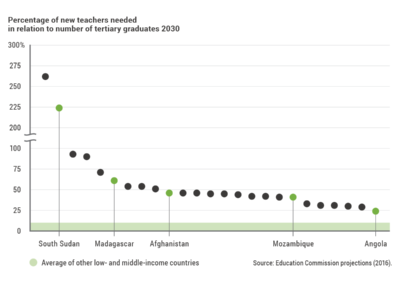
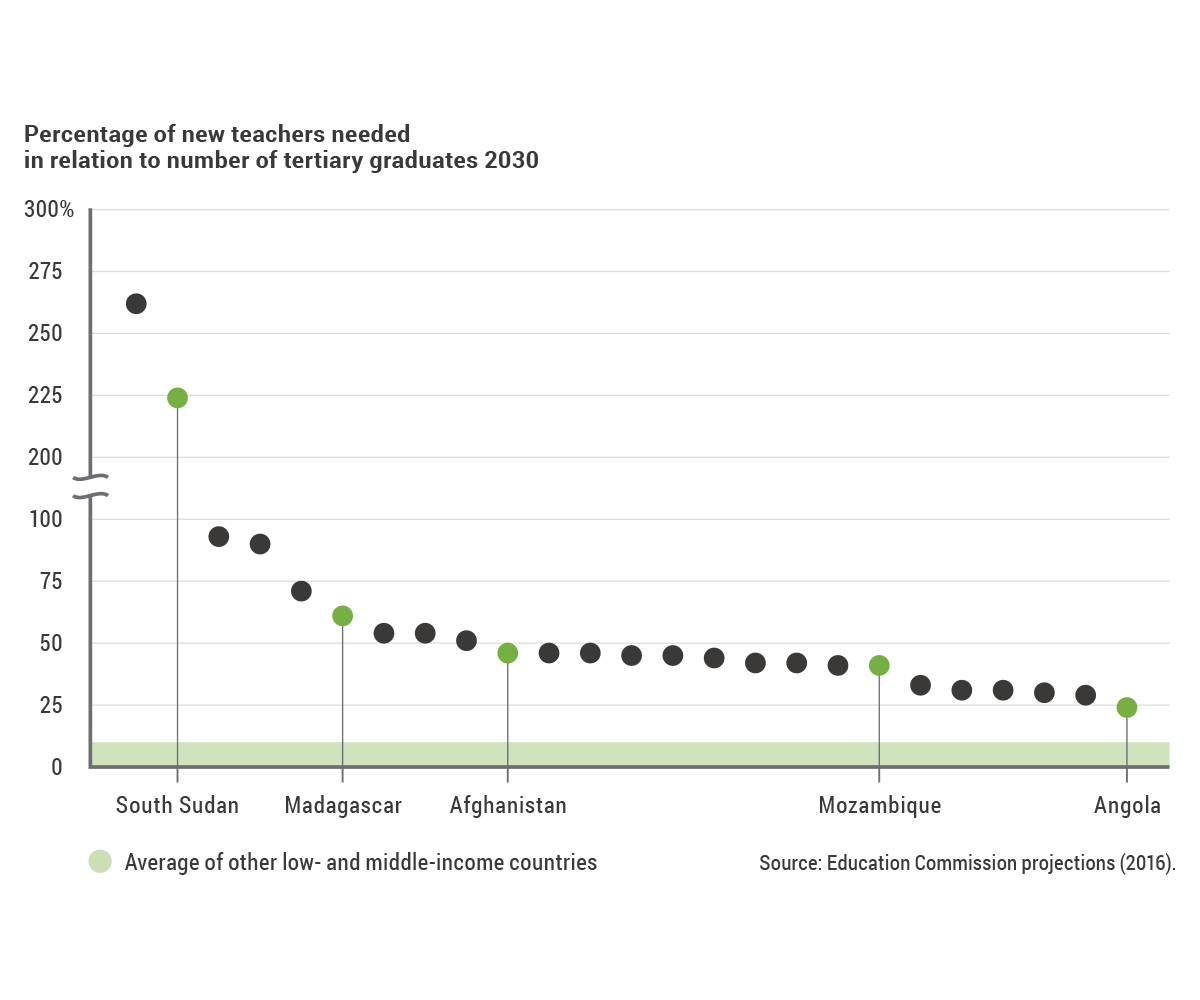
Source: Education Commission projections (2016).